Fleet data becomes valuable when it can be summarized, compared, and shared. This update introduced Excel downloads for the Activity Summary and added a report type designed to consolidate GPS tracking indicators by device and period.
Operations managers can move from an overview in ALTAGAMA GPS to a structured file for analysis, meetings, performance control, or collaboration with other teams. We also improved number and date formatting so exported files are clearer from the moment they open.
What the ALTAGAMA GPS Activity Summary provides
The Activity Summary brings key indicators generated from selected device history into one query. Instead of reviewing every individual location, users get a consolidated view of behavior during a period.
Depending on available sensors and data, it can include distance traveled, stop count and duration, movement and non-movement time, maximum and average speed, estimated fuel consumption, alerts, fuel levels, temperatures, and sensor activation time.
The summary guides analysis and helps determine which vehicle needs detailed review. It does not replace the location, route, and event history supporting each indicator.
Download the activity summary directly to Excel
The Activity Summary now includes an option to save results in Excel. Users select dates, groups, or devices, refresh the query, and choose the summary report used for the export.
The file supports filtering, sorting, pivot tables, additional calculations, and sharing with operations, maintenance, security, or customer service. Its scope follows the selected devices, period, and template.
Before distribution, confirm time zone, units, columns, and filters so every recipient interprets the report under the same conditions.
Excel download demonstration
The original video shows how to save the Activity Summary from ALTAGAMA GPS.
New report type: Activity Summary
We added a report type for building consolidated documents from summary indicators. Unlike a location report, which can produce one row for every position, this format groups information into an executive view by device or interval.
Columns can use operations such as sum, average, total, minimum, maximum, and other options available for the variable. Each organization can create a template around its objectives without recalculating every result after download.
One report could combine distance traveled, movement time, stop count, average speed, and alerts. Another could focus on temperature, fuel, and sensors for a specialized operation.
Consolidated report demonstration
The original video presents the selection of an Activity Summary report for a customized query.
What a company can analyze
- Productivity: distance traveled, movement time, stops, and inactive periods.
- Driving: maximum speed, average speed, and recorded alerts.
- Fuel: levels, changes, or estimated consumption when tracker data and settings support them.
- Cold chain: minimum and maximum temperature values on compatible devices.
- Sensors: active and inactive duration plus available first or last changes.
- Fleet comparison: equivalent indicators by vehicle during the same date range.
How to build a useful consolidated report
- Define the decision the report should support: productivity, safety, maintenance, temperature, or another objective.
- Select only variables connected with that decision.
- Choose the right summary operation for each field; not every variable should be added.
- Test the template with a few devices and a known period.
- Compare results with original history before distributing the report.
- Use a name that allows other users to understand the template scope.
Averages, sums, and totals are not interchangeable
Selecting the correct operation prevents misleading conclusions. Distance can be summed; speed is commonly analyzed through average or maximum; fuel and temperature may require minimum, maximum, or change; and an alert count represents a number of events.
Averaging averages from different periods can distort results when each period contains a different amount of data. For important decisions, review how the column was constructed and compare the aggregate with its details.
Clearer numbers in Excel files
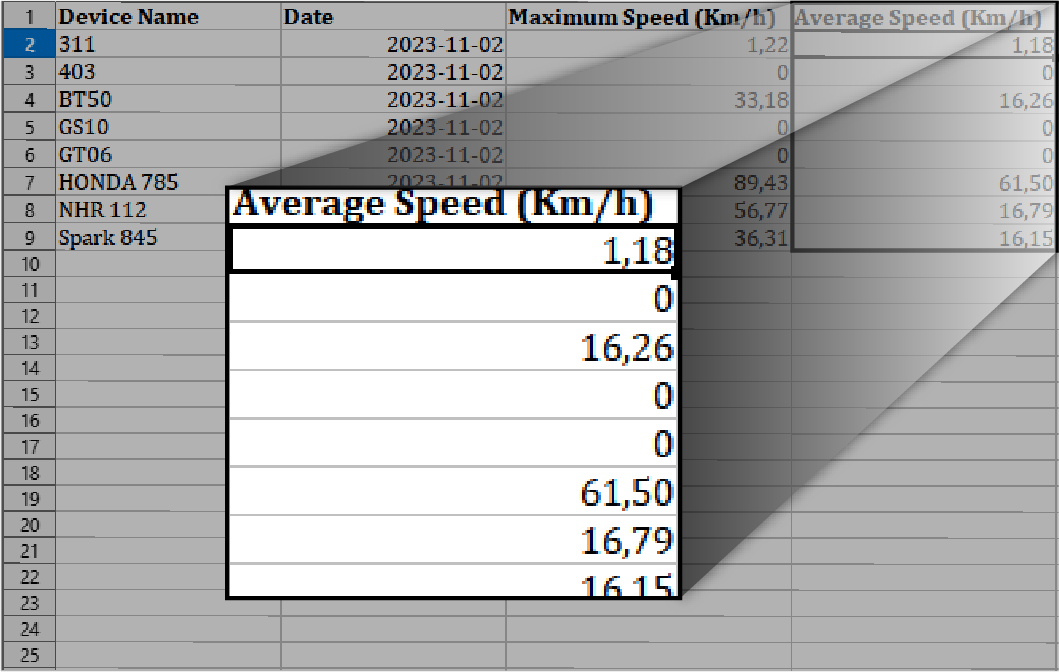
We improved numeric formatting in exports to show only significant decimal places. Files avoid unnecessary strings of zeros and present measurements clearly without converting them to text.
This makes columns easier to sort, filter, and calculate. Distance or average values remain numeric while presentation removes visual precision that does not contribute to the report.
The useful number of decimals depends on the value. Coordinates require more precision than a speed presented in an operations meeting.
Example of the new number format
The original image shows how values with relevant decimal places appear in the export.
Long dates displayed without truncation
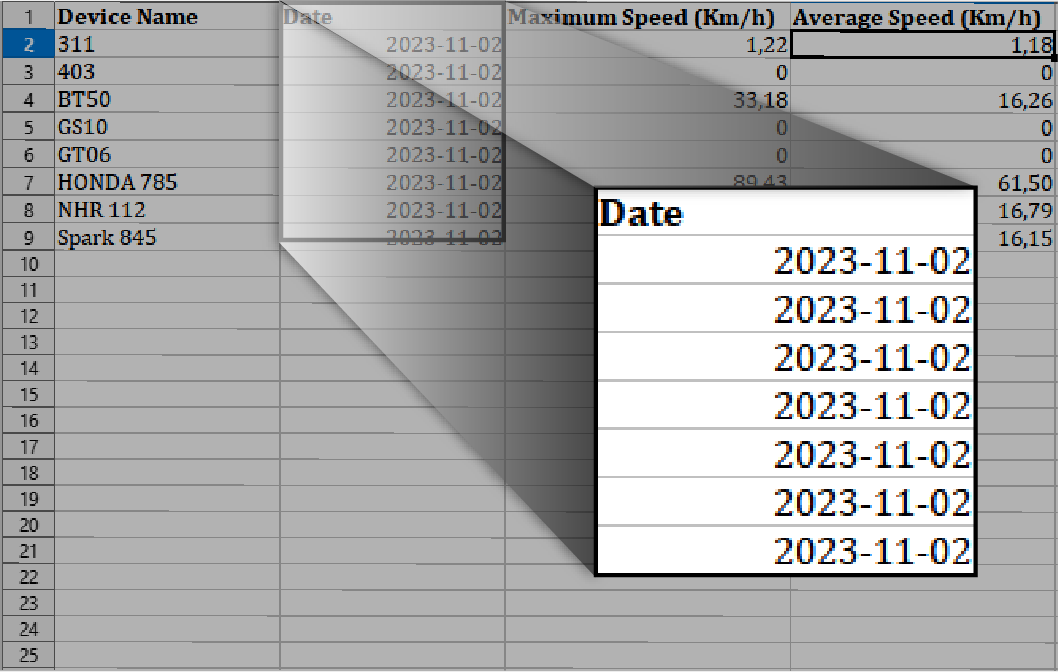
We adjusted long-date formatting and presentation so values are readable when the file opens. This reduces clipped columns, difficult-to-recognize values, and manual work before analysis begins.
Dates should be interpreted with the configured time zone. When a report is shared among branches, state that zone explicitly to prevent differences when comparing events.
Example of long dates in Excel
The following original image shows the improvement applied to date columns.
Real-world uses for fleet summaries
- Weekly close: compare distance, movement, and stops among vehicles.
- Driving review: identify speeds and alerts requiring a conversation or training.
- Preventive maintenance: use mileage and activity as references for planning inspections.
- Customer service: prepare a consolidated view of devices assigned to a contract.
- Cold chain: review temperature extremes and locate periods requiring investigation.
- Planning: identify underused vehicles or disproportionate routes.
A real-world case: monthly delivery reporting
A company selects its distribution vehicles and the month that just ended. It uses a report with distance, movement time, stops, average speed, and alert count.
After export, the fleet is sorted by distance and operating time is compared. Two vehicles show many stops and limited travel, so the manager opens history to distinguish normal deliveries, congestion, or planning issues.
The consolidated report prioritizes analysis without requiring thousands of positions from every unit to be reviewed. Final decisions still use detailed data, operational context, and validation.
Indicator quality and limitations
A summary can only calculate from information received by ALTAGAMA GPS. Accuracy depends on the tracker, reporting frequency, sensors, installation, configured units, and communication continuity.
Fuel consumption may be estimated, temperature requires a compatible sensor, ignition state depends on the assigned signal, and an alert depends on its rule. A missing value does not automatically mean zero.
For audits or critical decisions, retain the period, filters, and template, and validate anomalies against original locations.
Benefits for fleet managers
- Activity summaries downloadable directly to Excel.
- Consolidated templates adapted to different operating objectives.
- Sum, average, total, minimum, and maximum operations according to variable type.
- Numbers presented with significant decimal places.
- Long dates visible and ready to read.
- Less manual preparation before sharing or analyzing a file.
- A clear path from an aggregate indicator to detailed history.
Technical summary for users and analysts
- The Activity Summary report type works with aggregate indicators rather than one row per location.
- Exports follow the selected devices, period, and template.
- Available operations depend on variable type.
- Numeric values retain formatting suitable for Excel analysis.
- Non-significant decimal places are hidden for readability.
- Date columns are presented with readable format and spacing.
- Time zone, units, filters, and sensor availability should be reviewed before interpreting results.
Explore GPS tracking, activity summaries, statistics, and reports in the ALTAGAMA GPS plans and features.